Welcome to the modern world where data is the new oil and space travel is becoming commercialized. Surprisingly, modern businesses are still relying on a legacy spreadsheet tool released back in 1987 to fuel their data analysis and decision-making. This is not a knock on Excel, who became my love-at-first-successful-VLOOKUP. But the pace of business has evolved and so must we.
What practices should businesses follow to effectively manage organization-wide data analysis? How can we solve the vexing issues of “Excel hell” I confront at nearly every organization, while also taking advantage of a tool with outstanding user adoption and widespread skills? Simple…share this blog post with your decision-maker and invest in Power BI.
The specific issues intrinsic to Excel are:
- Different versions of the same Excel workbook are littered all over the organization from your email inbox, desktop, and intranet.
- Mass emails of an Excel workbook instantly create multiple versions of truth.
- No centralized way to govern how one person calculates a business metric like revenue from one workbook to another.
- Data consumption in the same place you develop the analysis—one fat-fingered cell turns into #REF?s or broken links.
New Excel features are only released yearly. Yet, uncharacteristically, 2020 brought some of the most compelling Excel features to support data governance capabilities. Most of these capabilities are thanks to Excel’s dynamic duo, Power BI. Power BI is updated monthly—it has driven the core technology that has slowly been shared with Excel and more deeply integrated.
Here’s what we know about the product releases that are building a stronger connection between Power BI and Excel to help your organization take Excel to the next level.
Excel is a Strong Analysis Tool with One Major Drawback
As my colleague, Brian Grant, likes to say: “Long after Earth has been destroyed in the apocalypse, two things will remain: cockroaches and Microsoft Excel.”
Excel is the world’s most widely used “database.” It is estimated that 750 million people currently use Excel worldwide. Practically every organization uses Excel for data analysis. It has been optimized for deep analytical capabilities and flexible ad-hoc work.
A shocking number of systems and business intelligence tools still require users to export their data into Excel or CSV formats where it can be formatted, combined with other data, and commented on. Systems are WAY too reliant on Excel, making governed data analysis much, much harder than it needs to be.
Using pivot tables, power pivot, conditional formatting, VLOOKUP, and all the functionality we have learned to love, users create functional reports to their liking in a matter of minutes. There is no doubt about it…Excel is the king of ad-hoc data analysis.
Excel is a strong, versatile analysis tool with one major drawback in this collaborative world—controlled sharing. An average business user’s daily work will involve some Excel, creating analysis, visuals, and data manipulation (among many other things).
When the user is ready to share amongst their teams, the Excel file will typically be attached to an email and distributed. This is a poor practice as it leads to multiple versions of the truth, broken formulas, and copious amounts of repetitive data clogging up a network.
Imagine an analyst trying to corral multiple files from multiple emails to create higher-level reports. Like herding cats, it is inherently uncontrollable. This system will leave users frustrated, and more importantly, lead to decisions that are driven by bad data.
Power BI Features That Solve Excel Problems
Thanks to the following Power BI features, Excel’s historical problems have been solved.
All Hail Power Query
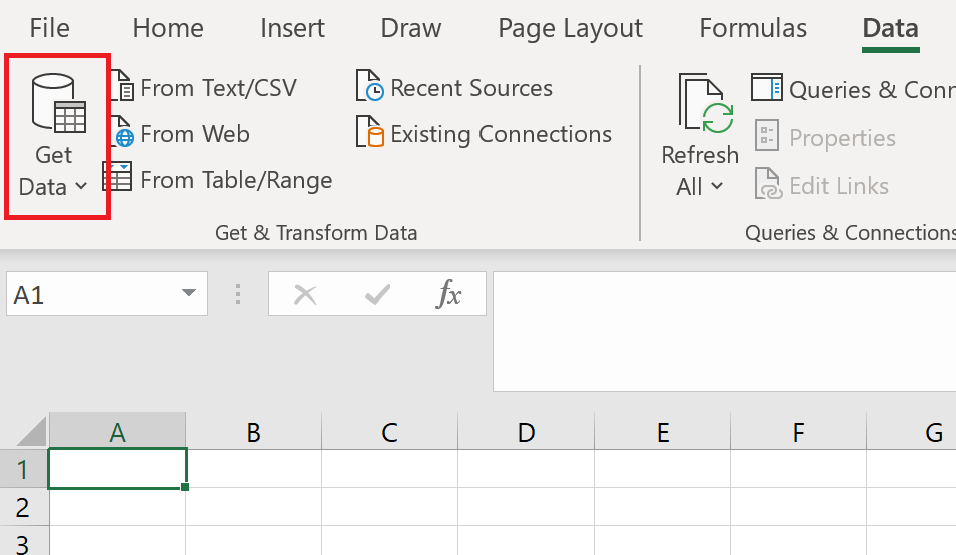
Are you still copy-pasting data into your Excel spreadsheets? If so, please stop. Power BI’s hallmark technology called Power Query has been incorporated into Excel and called “Get Data” so you can connect to your data as a query or connection.
Power BI Datasets as Excel Source of Truth
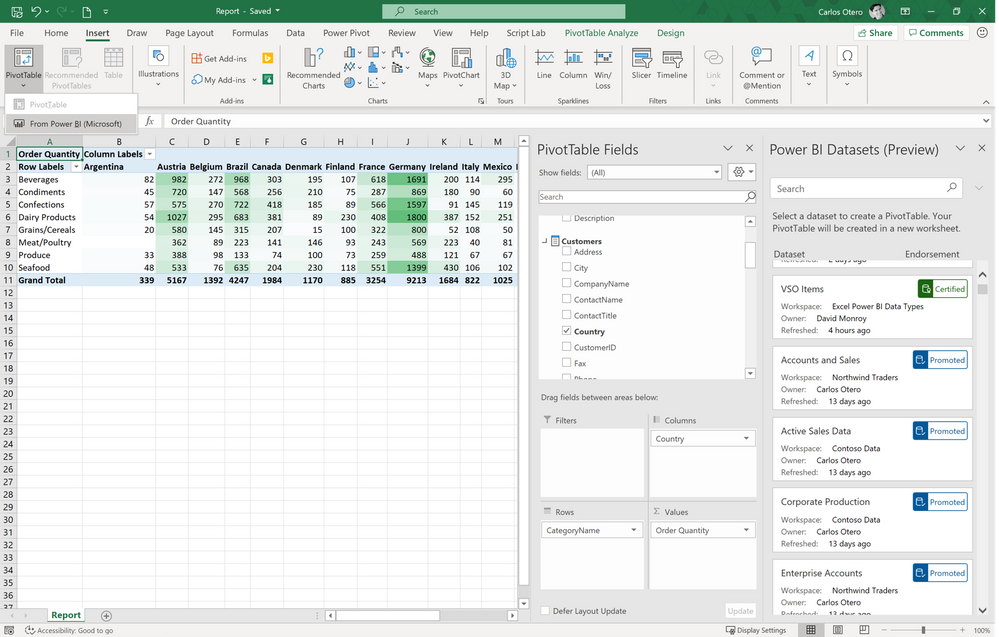
Your investment in robust analytical models called Power BI datasets pays dividends in Excel. By using Power BI certified and promoted dataset capabilities, businesses find and use a single source of truth to make better decisions, centralize business measures, and calculate KPIs cohesively.
Power BI Data Types in Excel
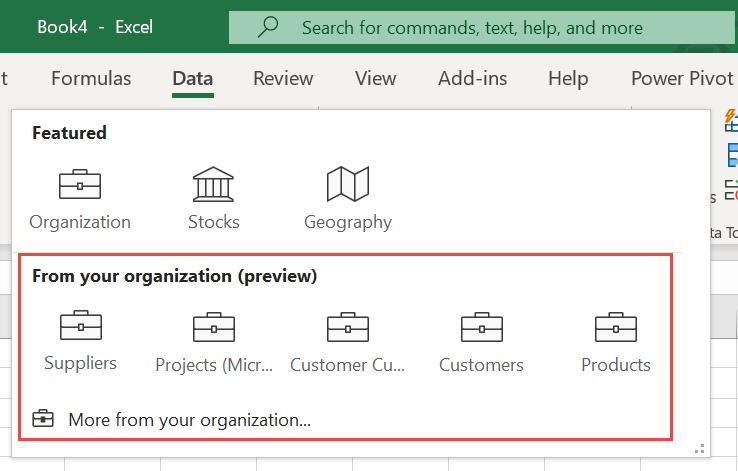
Turn on this preview capability in Power BI to enable data types galleries when connecting with Excel. By using custom, live data types, users analyze details from tables in Power BI datasets within Excel’s data types gallery.
This connected data can then be formatted, combined with other data, and commented on—all features that are difficult in many BI tools. Users create featured tables in Power BI datasets for others to easily add enterprise data into their Excel sheets.
Analyze in Excel
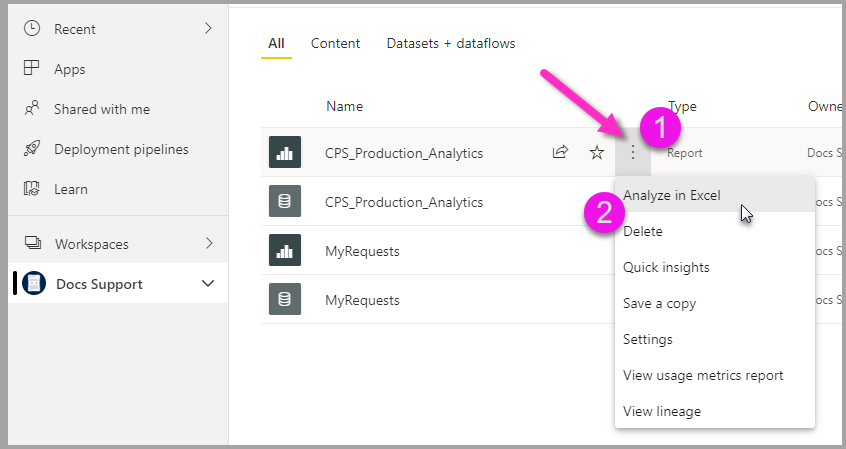
If you are on PowerBI.com and found a report you would love to have your way with in Excel, look no further than the Analyze in Excel feature! Super easy to access, follow these steps:
Data Protection is a Forethought
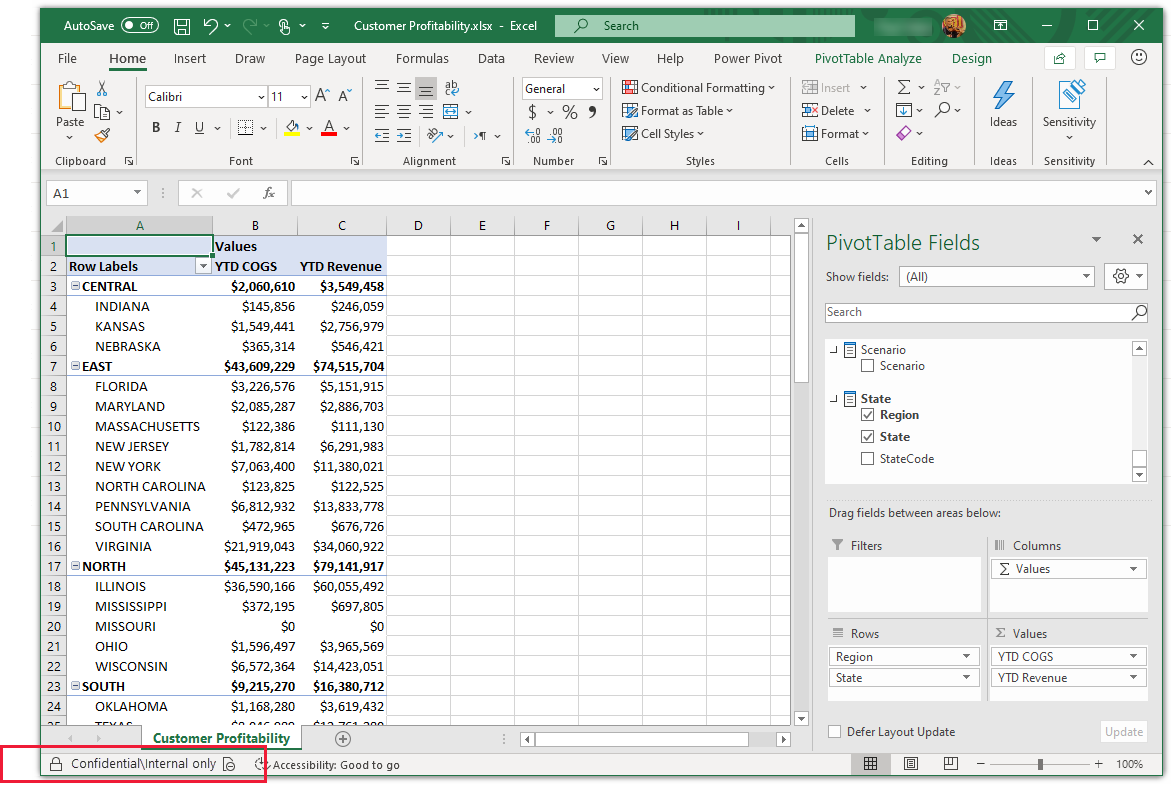
Avoiding traditional data export methods isn’t just about convenience for analysts. It’s also about data security. When you export to Excel or CSV, you lose all the embedded security measures for the data being exported. Rather if you are connecting to Power BI datasets with sensitivity labels, then all of the Microsoft Information Protection controls remain in place.
Key Benefits of Power BI Excel Features
Firstly, avoiding data export is not simply about ease for analysts, it is about data security. When you export to CSV, you lose all security on the data. But if you are still connected, then all the Microsoft Information Protection controls remain in place.
Secondly, bringing a new tool into an organization always involves a headache of change, training, etc. Nearly everyone who works with data already knows how to use Excel. Additionally, no tool offers the ad-hoc flexible formatting control of Excel.
When you curate your certified datasets in Power BI service, you give analysts connected, secure, refreshable access to the single source of truth in Excel. As mentioned in this Verge article:
“These new Power BI data types will be available in Excel for Windows for all Microsoft 365 / Office 365 subscribers that also have a Power BI Pro service plan. Power Query data types are also rolling out to subscribers. On the consumer side, Wolfram Alpha data types are currently available in preview for Office insiders and should be available to all Microsoft 365 subscribers soon.”
These deeper integrations between Power BI and Excel give businesses the power to more securely and confidently make smart decisions from centralized datasets. Combining the collaboration strengths of Power BI Service with the well-known flexible analysis ability of Excel creates a truly robust business intelligence paradigm for organizations to face our rapidly evolving business needs.
For help on standing up a robust Power BI foundation for your Excel-loving organization, reach out to us here at Skypoint..


