

How to Call Power BI REST APIs with Custom Connector and Postman
It’s time to make space for your most essential Power BI reports. Learn how to call Power BI REST APIs with Custom Connector and Postman.

It’s time to make space for your most essential Power BI reports. Learn how to call Power BI REST APIs with Custom Connector and Postman.
Join the creators of the Power BI Adoption Roadmap for a discussion about successful Power BI adoption and a healthy data culture in your organization.
This session will help you understand evaluation context, so the next time you create a DAX measure, the result will be consistent and expected.

Connecting Power BI to QuickBooks isn’t exactly plug-and-play. Using ODBC drivers is complex but doable. Here are a few tips and a list of top ODBC connectors.
Grouping tables in Power BI is a powerful modeling technique that allows you to select from overlapping groups either in a slicer or across a matrix.
You may want your Grand Total line to appear at the top of the Power BI Matrix. Achieving the effect involves a little bit of Power BI magic.
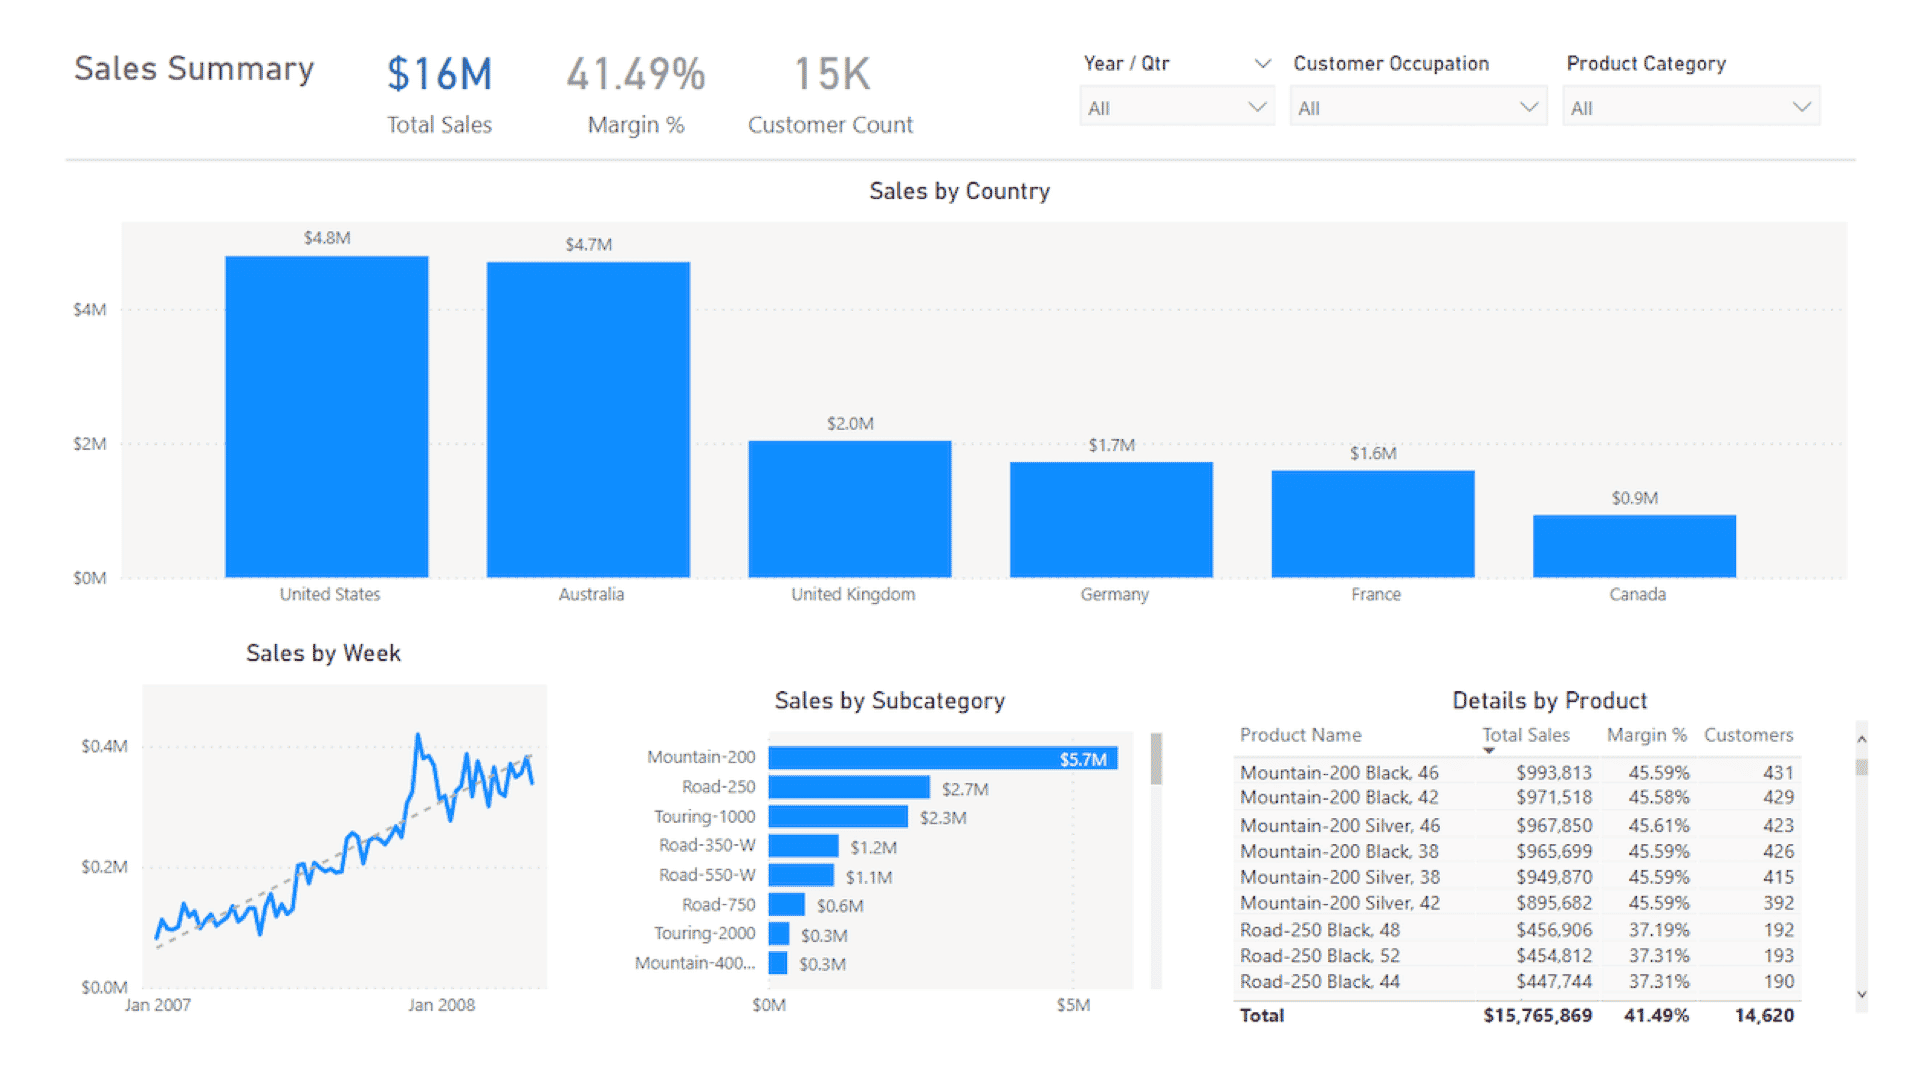
Some Power BI report design skills take years to master. These basic visualization concepts are easy to learn and they will make your reports far better.
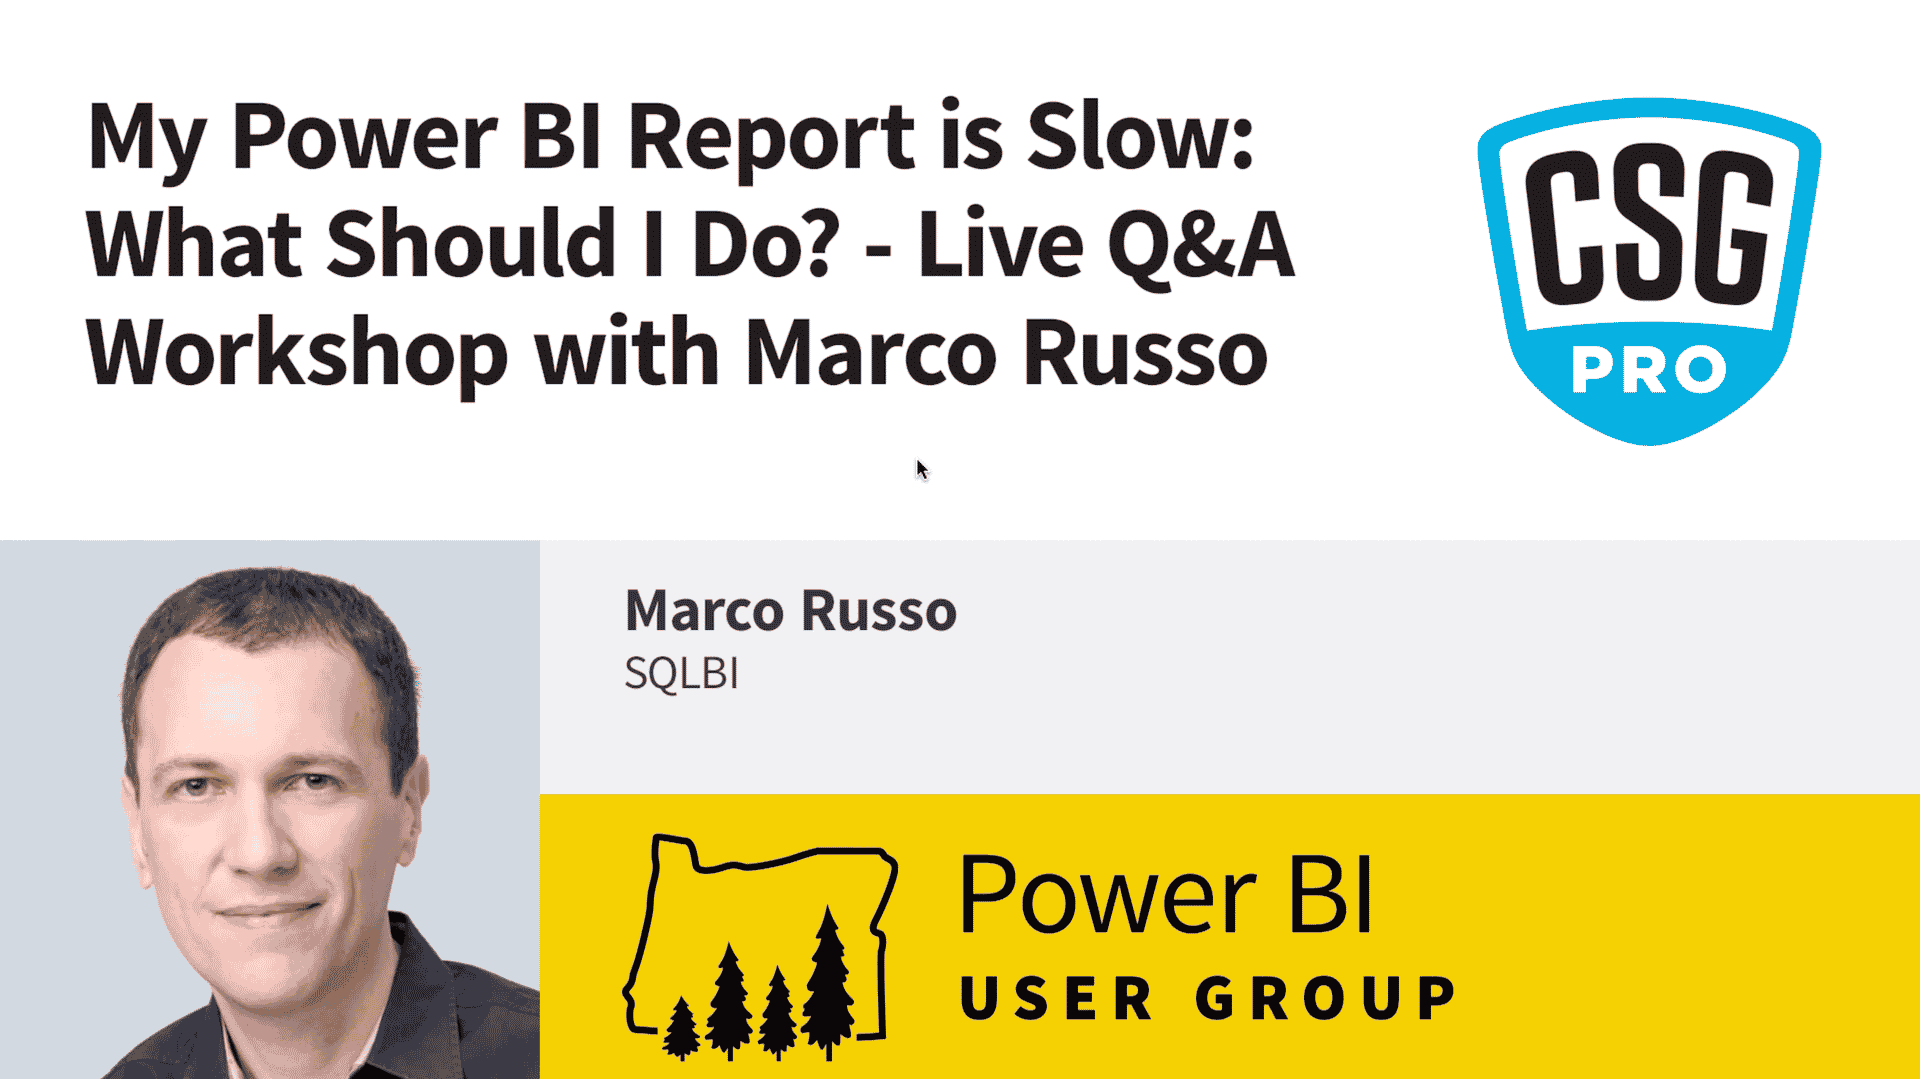
This session is purely Q&A with Marco Russo on Power BI report optimization and will guide you in analyzing the possible reasons for a slow BI report.

Power BI deployments are resource-intensive projects that require managing many moving parts and competing priorities. Plan for success with this approach.

Even for simple Power BI deployments, you need a strong team. These are the roles you need to fill, along with the skills and responsibilities required for each.
It’s time to make space for your most essential Power BI reports. Learn how to call Power BI REST APIs with Custom Connector and Postman.
Join the creators of the Power BI Adoption Roadmap for a discussion about successful Power BI adoption and a healthy data culture in your organization.
This session will help you understand evaluation context, so the next time you create a DAX measure, the result will be consistent and expected.
Connecting Power BI to QuickBooks isn’t exactly plug-and-play. Using ODBC drivers is complex but doable. Here are a few tips and a list of top ODBC connectors.
Grouping tables in Power BI is a powerful modeling technique that allows you to select from overlapping groups either in a slicer or across a matrix.
You may want your Grand Total line to appear at the top of the Power BI Matrix. Achieving the effect involves a little bit of Power BI magic.
Some Power BI report design skills take years to master. These basic visualization concepts are easy to learn and they will make your reports far better.
This session is purely Q&A with Marco Russo on Power BI report optimization and will guide you in analyzing the possible reasons for a slow BI report.
Power BI deployments are resource-intensive projects that require managing many moving parts and competing priorities. Plan for success with this approach.
Even for simple Power BI deployments, you need a strong team. These are the roles you need to fill, along with the skills and responsibilities required for each.