Delivering high-quality care while staying profitable is a key concern for any senior living operator. Efficiency is the name of the game — but many operators face persistent data challenges that hamper operations, burden staff, and steal time away from resident care.
In our work with senior living operators such as Bickford Senior Living, we’ve seen how carefully crafted Power BI reports can improve efficiency — sometimes as much as 99% — and help operators provide better care with lower expenses. These reports connect disconnected systems and link up critical data silos. No more tedious spreadsheet merges — everyone gains access to a single source of truth.
Deploying Power BI within your senior living organization can help you:
- Increase productivity.
- Ensure compliance.
- Improve occupancy rates.
- Minimize billing errors.
- Support strategic decisions.
If you’re curious about how you can start cultivating a strong data culture in your senior living operation and reap serious efficiency gains, we’ve assembled a list of Power BI reports that consistently deliver the most value. Read on to learn more!
Forecasting Power BI Reports
Weekly Census
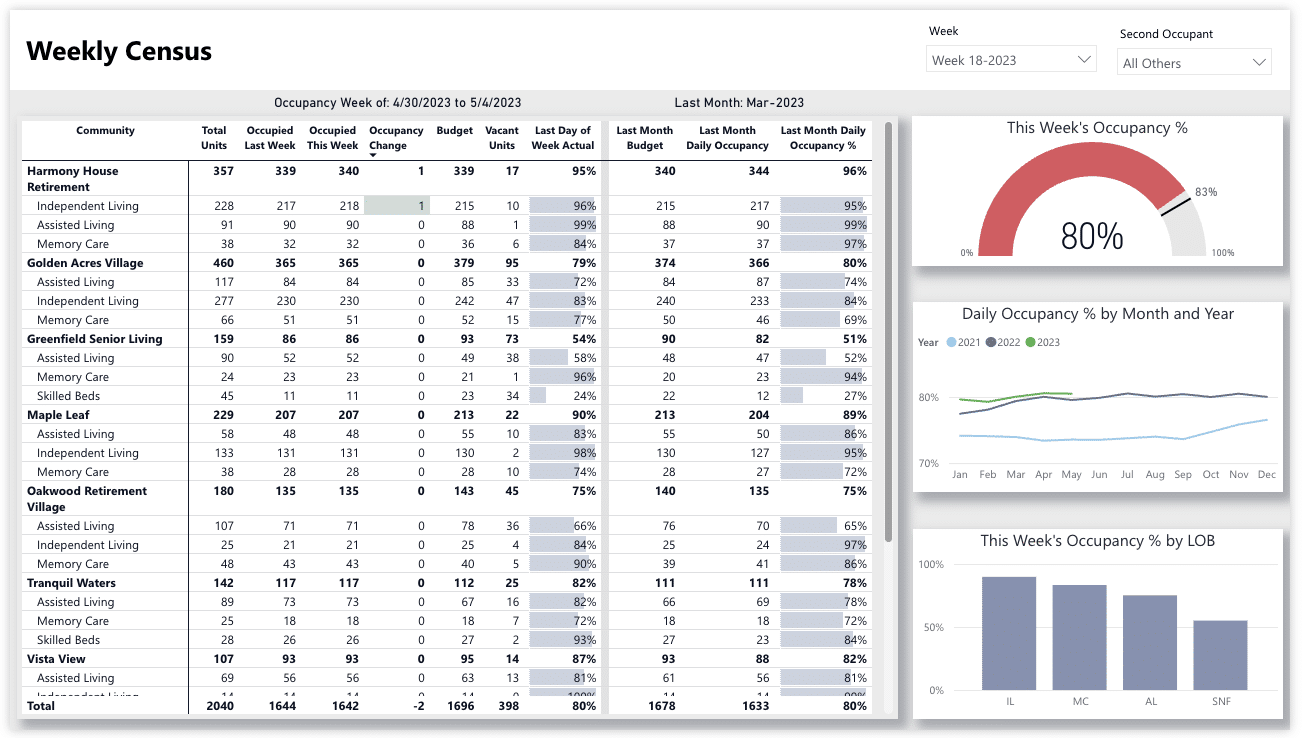
The weekly census report automates all census and occupant reporting and shows the total number of units in a facility. This report helps you answer questions like:
- How many units are empty?
- How full is a facility?
- How has the occupancy rate changed?
- Which units were occupied last week vs. this week?
- Where do we stand compared to our budget?
Like many Power BI reports, you can customize this report to meet your needs. Use the time slicer to compare changes daily, weekly, monthly, quarterly, and annually.
Additionally, you can filter data by payer type, display room counts, or see line of business (LoB) breakdowns within one facility or across locations.
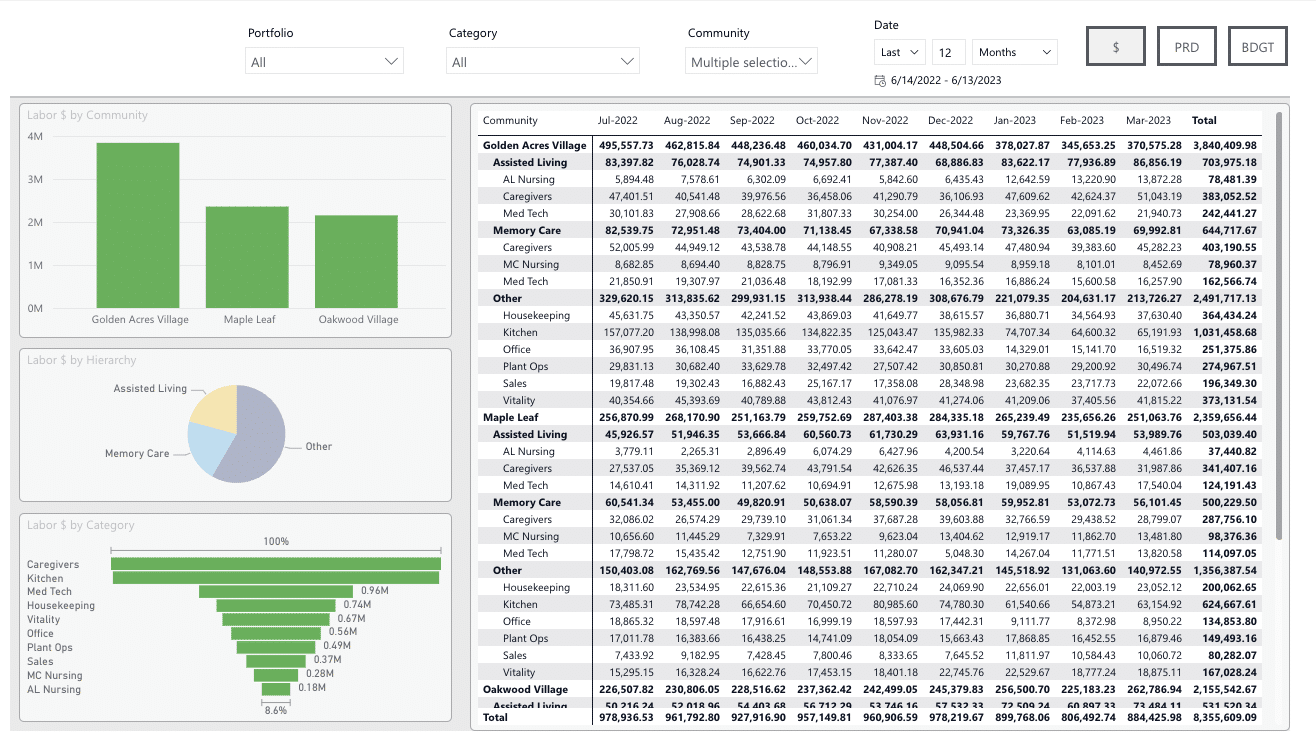
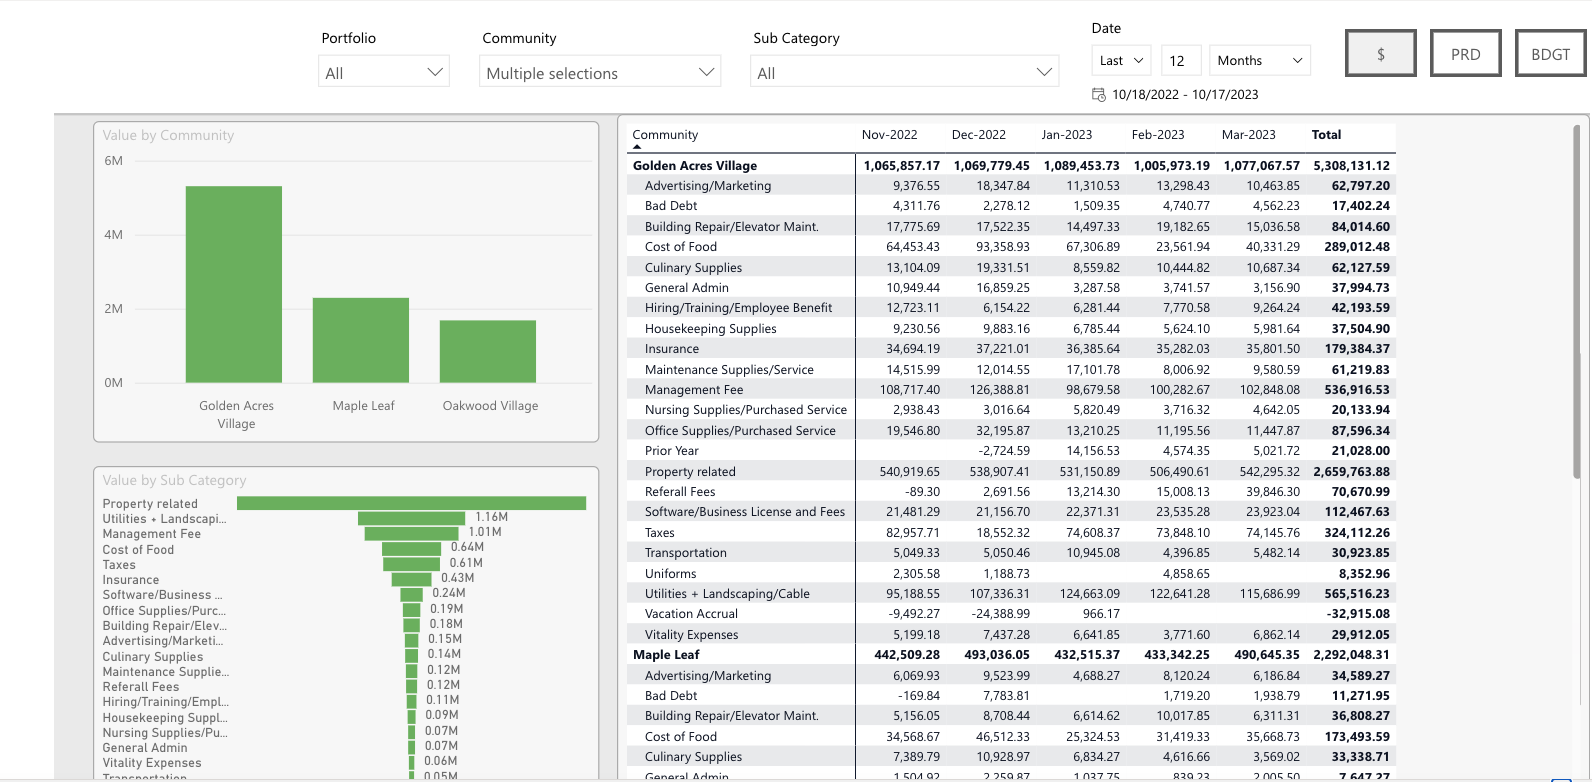
Expense Comparison
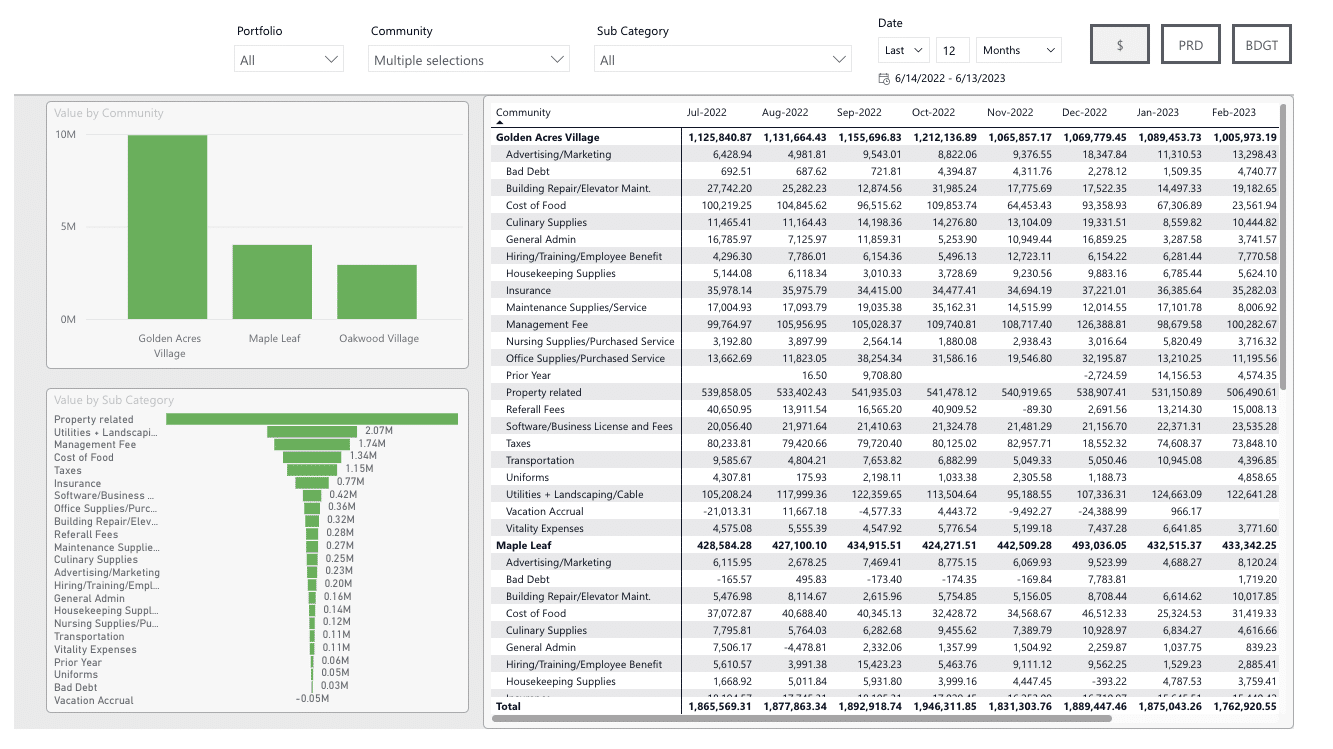
The expense comparison report displays how expenses compare across selected facilities in a senior living portfolio.
With this report, you can see how your costs change within expense categories, or where facilities with lower expenses are saving money compared to facilities with higher expenses.
Labor and Expense Forecasting
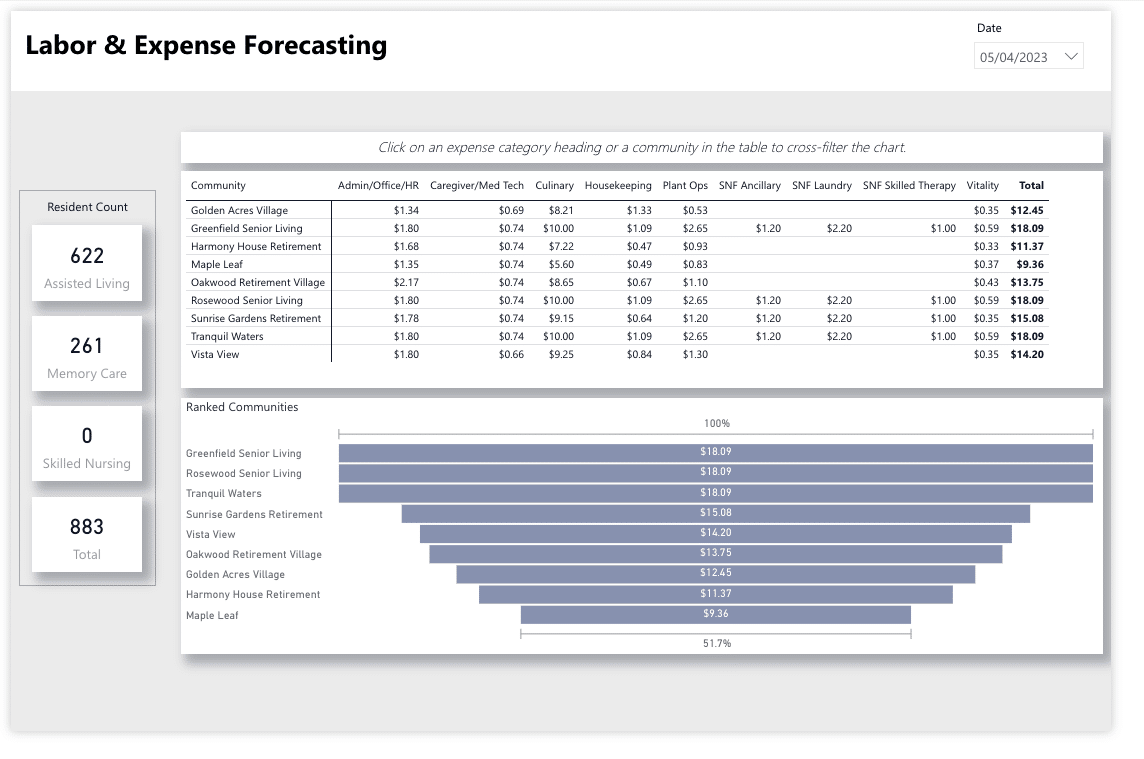
The labor and expense forecasting report helps you understand how many employees you need for each role throughout the day. This helps you make accurate cost forecasting and labor scheduling decisions, and maintain the required staff-to-resident ratio based on your census count.
This report also helps you compare your forecast with your scheduling tool to ensure you have the appropriate employees on duty at each facility. You can also use this report as a budgeting tool to understand daily, weekly, and monthly costs based on your resident count.
Rent Roll
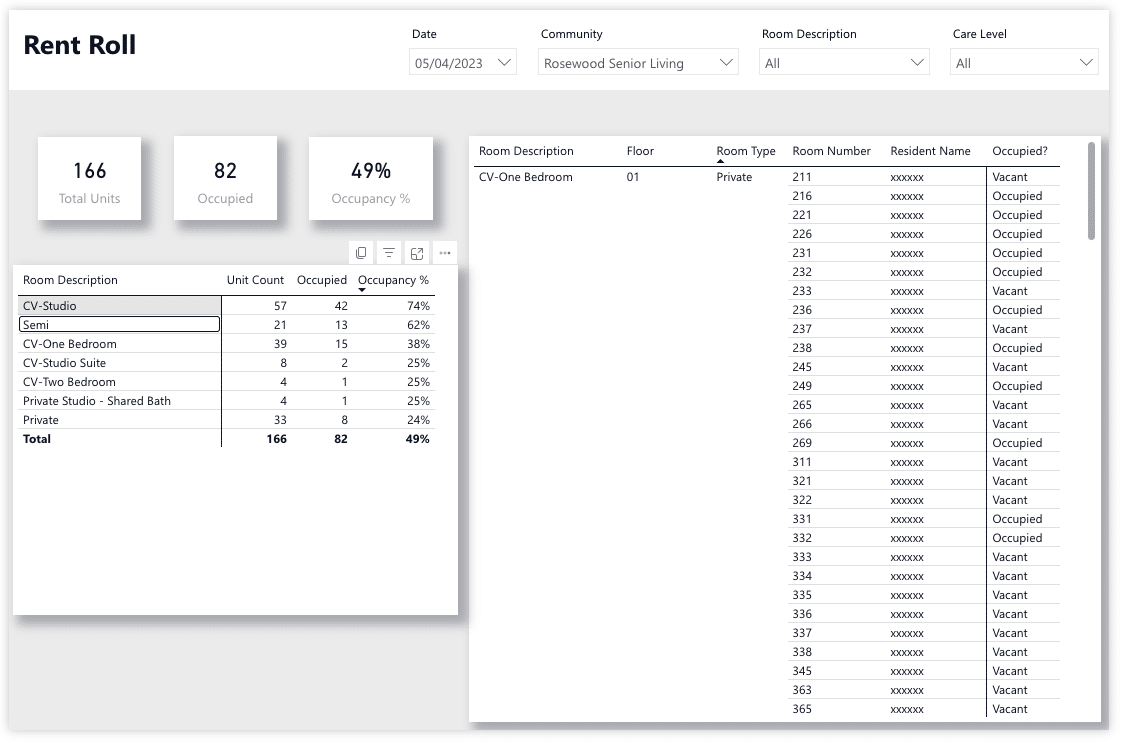
The rent roll report shows you a breakdown of all the rooms in a facility or community. You’ll gain granular insights into each facility, seeing which rooms are occupied and the care level assigned to each room.
Payer Type
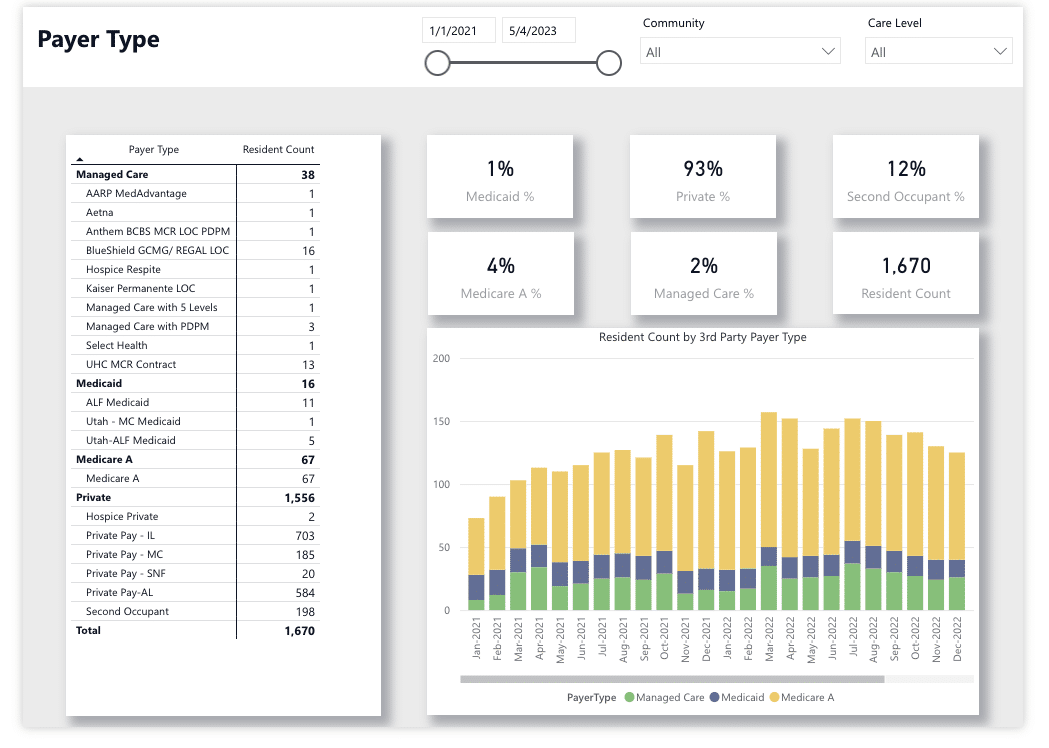
The payer type report shows the percentage of various payer types (i.e. private payer, managed care, or Medicaid) for each facility and how each changes over time.
You’ll be able to filter this dashboard by care categories — such as independent living, memory care, assisted living, and skilled beds — or use the date slicer to see a breakdown of payer types within a specific timeframe.
Sales Activities
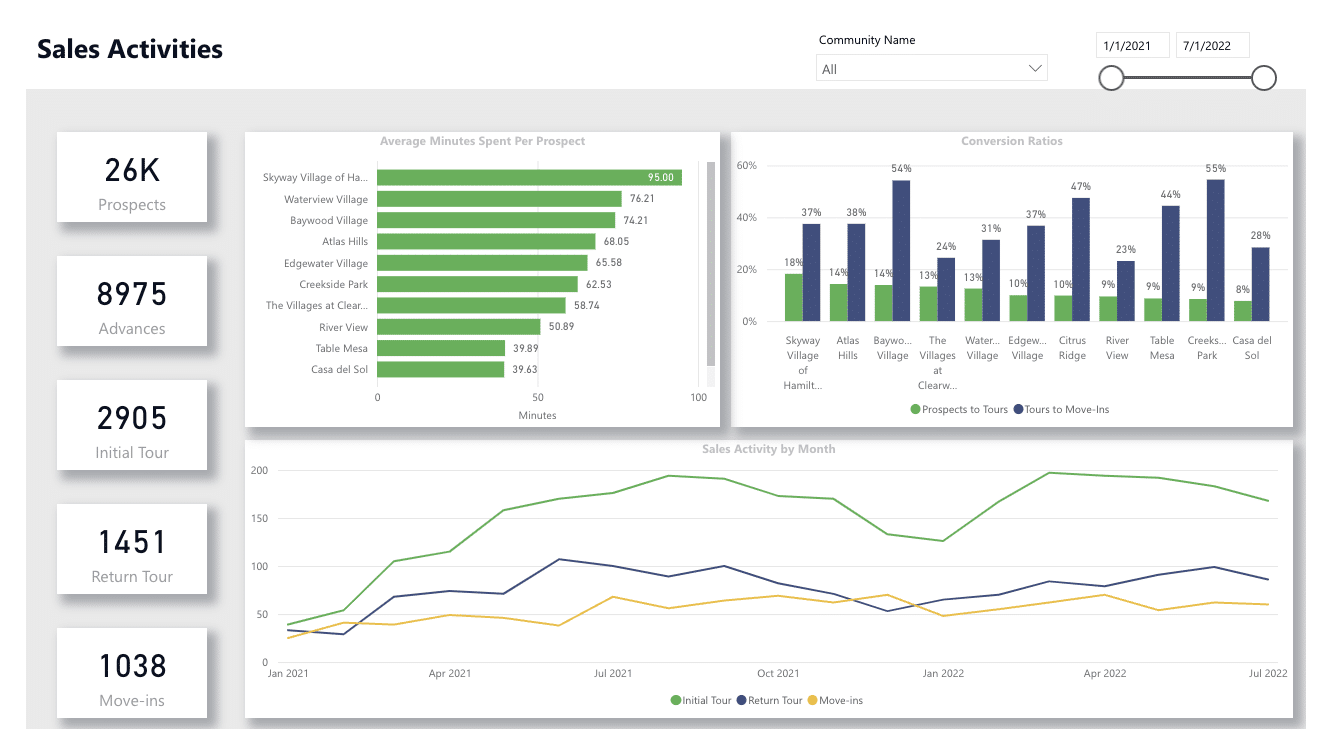
The sales activities report shows you the status of all the activity in your CRM within a specific time period.
You can use this report to see how many prospects you have at each facility or within a desired date range, find out which prospects advanced in your sales process, and analyze conversions at each step in your sales motion to adjust your strategy.
You can also compare sales data across all your facilities and correlate sales with other events, such as outbreaks of disease.
Labor Overview
Labor is typically the most significant expense for senior living operators. The labor overview Power BI report can help you optimize staffing across your facilities, including nurses, caregivers, med techs, and more. Importantly, it shows you overtime hours at a glance, so you can more easily control spending and stay within budget.
Financial Power BI Reports
Summary Financial Table
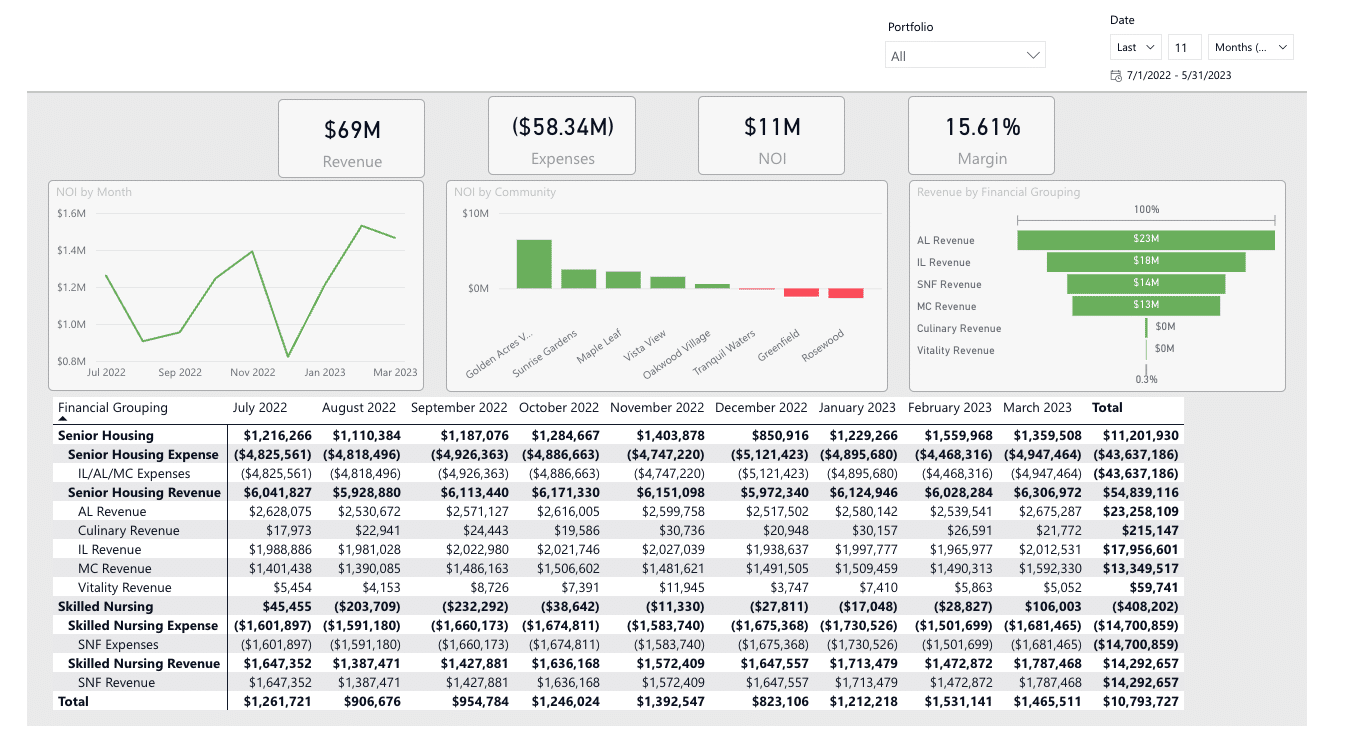
The summary financial table provides a single source of truth for C-suite leaders and executive directors to better understand the general status of their portfolio.
This automated report ingests journal entries and income statements, and shows critical financial data for each facility, including:
- Revenue.
- Expenses.
- Net operating income.
- Margin.
You can break down or cross-filter the table by portfolios, slice data by time periods, or analyze the performance of specific categories.
Facility Overview
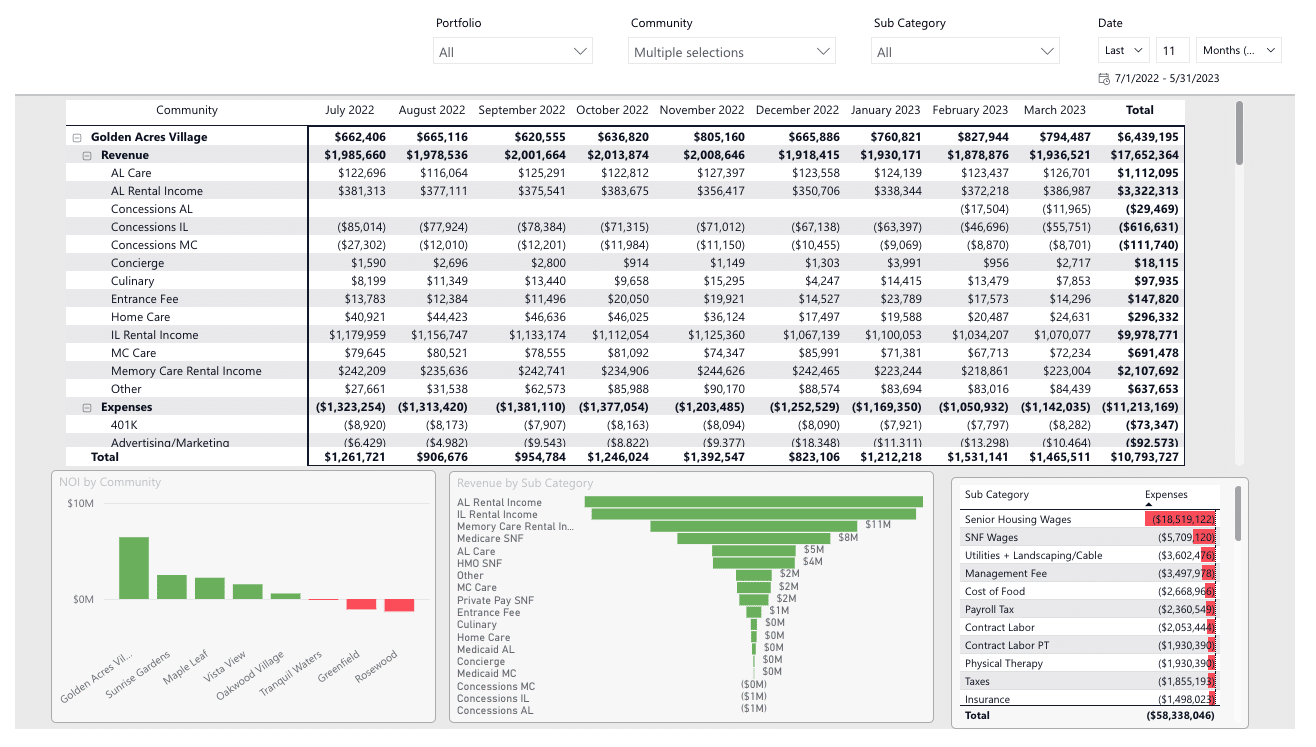
The facility overview report helps senior living operators normalize Per Resident Day (PRD) across categories.
You can use the insights provided in this report to compare performance across your entire portfolio, analyze each facility’s spending, and target immediate remediation actions for facilities that are over budget.
Revenue Variance
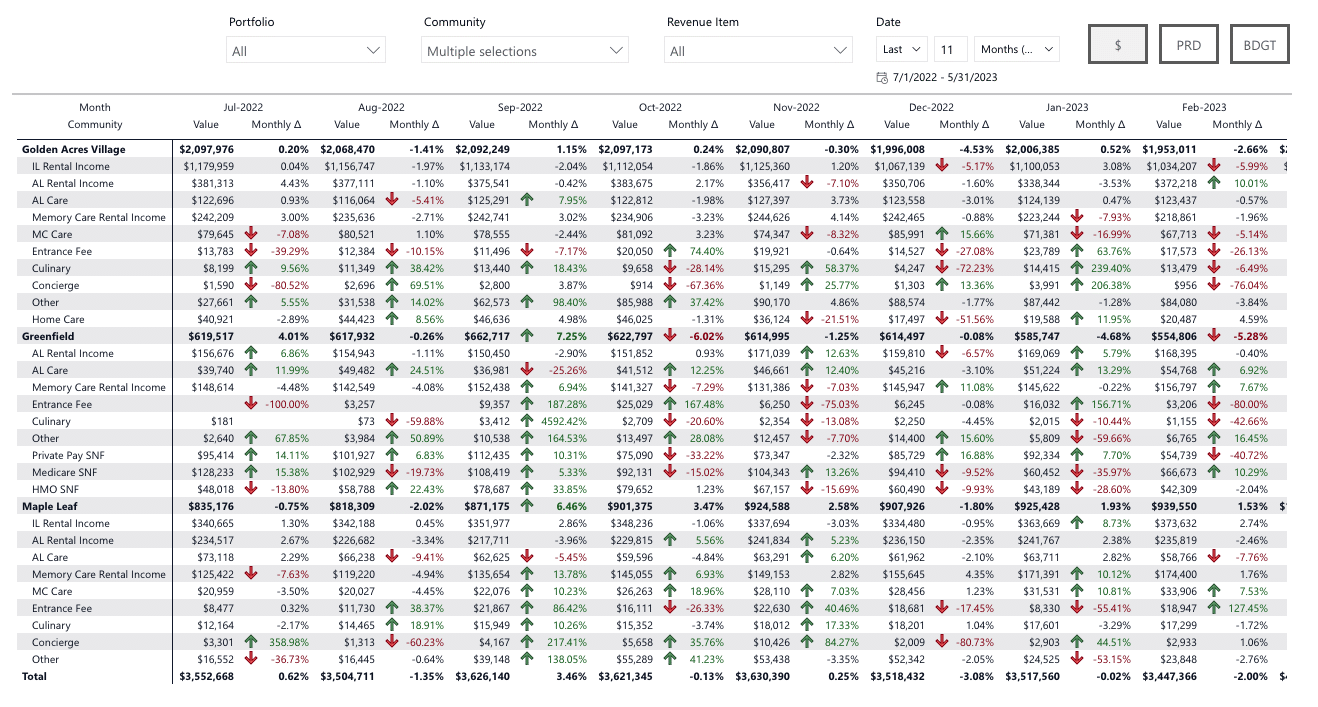
The revenue variance report shows revenue across categories such as rental income, concessions, and concierge, and helps you understand residents’ needs and preferences at a granular level.
With this insight, you can provide the right mix of services and offerings to keep your residents happy and maximize your income.
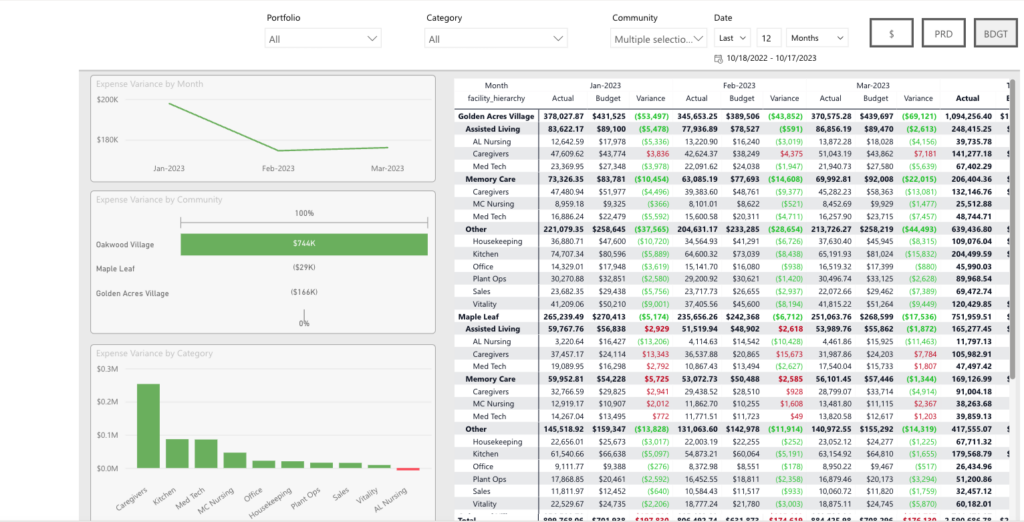
Expense Variance
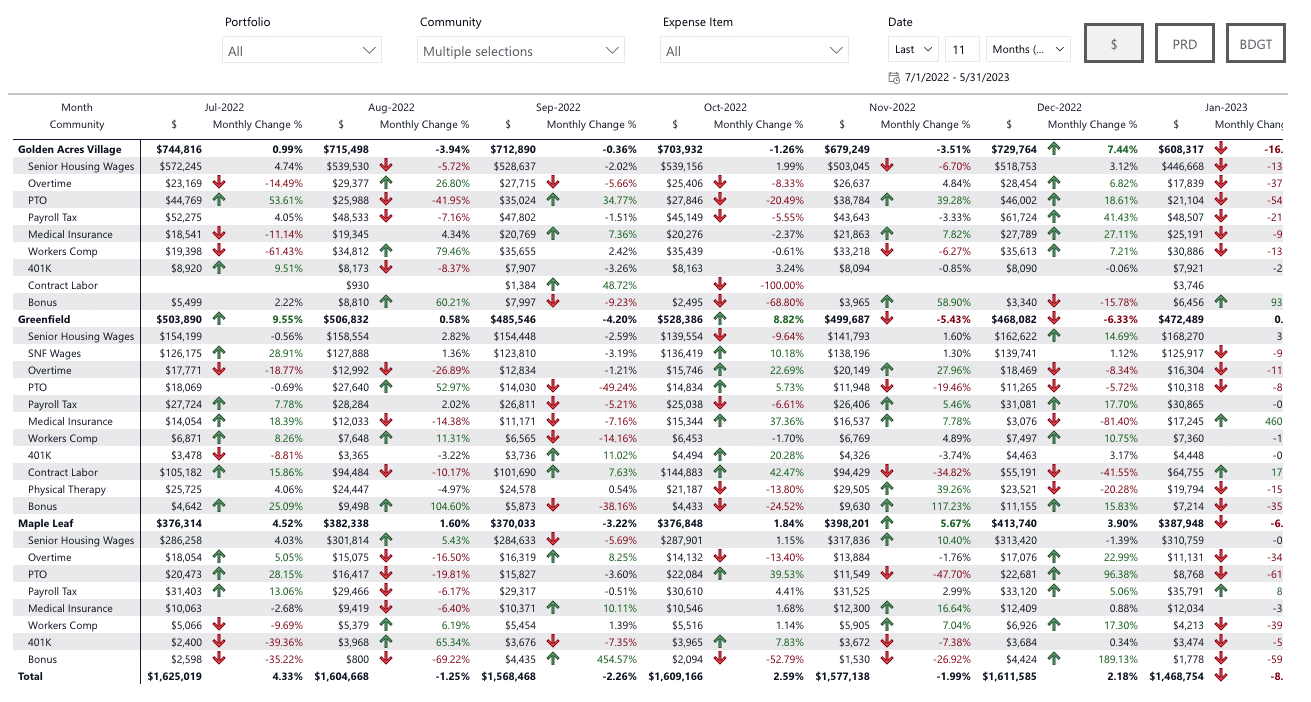
The expense variance report breaks down spending across facilities into specific categories, such as senior housing wages, SN wages, utilities, and landscaping.
This report helps you understand PRD expenses and compare budgets across your entire portfolio or for specific communities.
Additionally, you’ll be able to analyze labor costs at the care level or in general roll-ups, such as nursing, caregiving, med techs, housekeeping, or kitchen.
Expense Detail
The expense detail report shows a breakdown of all revenue roll-ups over a specific time period, such as dollar value and a monthly delta (percentage change from the prior month).
You’ll gain a clear understanding of your operation’s performance in one glance, with positive or negative trends indicated by conditional formatting.
Labor Variance
The labor variance Power BI report shows actual labor costs across facilities or in each community, and compares them with your budgeted costs.
You’ll be able to generate quick breakdowns of anything from labor to overtime hours. And, by comparing spending across your portfolio and against your budget, you’ll have the insights you need to make targeted improvements.
Turn Siloed Senior Living Data Into Actionable Insights
We hope you’ve gained clarity into how well-crafted Power BI reports can help you turn disparate data into coherent and actionable insights. If you’re ready to escape Excel Hell, or need support with your data and reporting initiatives, we’re ready to help.
Skypoint provides applied AI and data engineering for regulated industries such as healthcare, senior living, financial services, and the public sector. If you’d like to learn more about how Skypoint can help your organization get AI-ready, contact us today.